Process Fundamentals
Never trust a computer you can’t throw out a window.
—Steve Wozniak
What is a process in CBE?
A chemical process is a combination of steps in which starting materials are converted into desired products using systems, equipment, and conditions that facilitate that conversion.
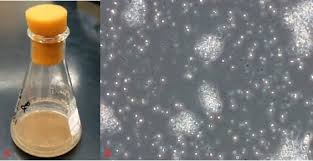
More generally, CBEs need to think about processes that are not only chemical, but also biological and physical.
Exercise: Process examples
Write down an example of a chemical, a biological, and a physical process.
From an engineering perspective, what sorts of information might we want to know about these processes?
Some useful process terminology
In a batch process, an allotment of starting material is introduced into the process, and a sequence of steps to treat that material is started and finished within a certain period of time, often within the same piece of equipment. The process is then interrupted, the processed material is removed, another allotment of the starting material is introduced, and the sequence of steps is repeated. Example: materials are loaded into a reactor, a reaction is carried out in the reactor, and then the final materials are removed.
A continuous process operates without interruption in the flows and reactions of the process. The starting material enters continuously, is usually subjected to various steps by moving from one piece of equipment to another, and exits the process continuously. Example: materials continually flow into and out of a reactor, while the reaction proceeds as the material moves through the reactor.
Steady-state is a condition on any process in which none of the characteristics of interest (temperatures, flow rates, pressures, and so forth) change with time. A process that is not steady-state is termed unsteady-state, time-dependent, or transient.
steady-state is not the same as equilibrium
A system that is in a steady state remains constant over time, but that constant state requires continual work. This condition is also referred to as a system in dynamic equilibrium. Were the process maintaining the system to cease, the conditions would not remain. A system in a steady state has a higher level of energy than its surroundings. Steady state processes can be as complex as interconnected biochemical reactions or as simple as flow into and out of a system to maintain a constant volume.
A system at equilibrium is stable over time, but no energy or work is required to maintain that condition. No free energy will be entering or leaving a system in equilibrium. The system is maintained in a low free energy state that is no different from that of its surroundings.
What about products
A product is generally the implementation of one or more processes that provide some utility to its consumer.
What is the effect of the process scale?
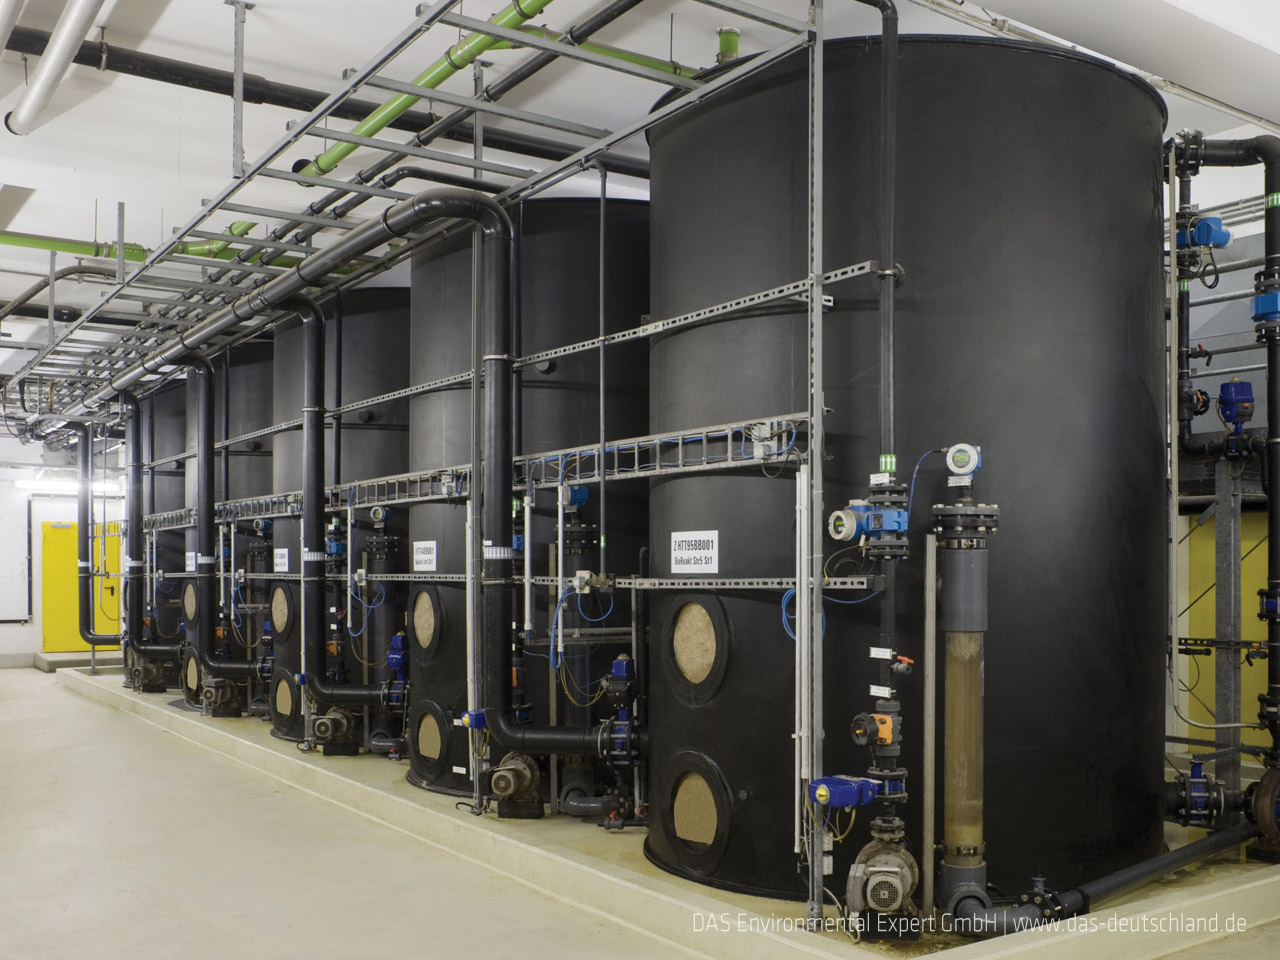
Scale can have important impacts on CBE phenomena, processes, and products.
Exercise: Process scaling
You have taken data on the growth of a new strain of bacteria using a bench-scale reactor.
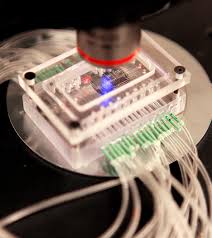
Think about ways that this information can be used to design a reactor for (i) industrial production and (ii) a miniaturized bioanalytical device.
What factors may change as a function of scale?
Are these same factors relevant for scaling a test tube chemical reaction?
Graphically representing processes
block diagram
process flow diagram
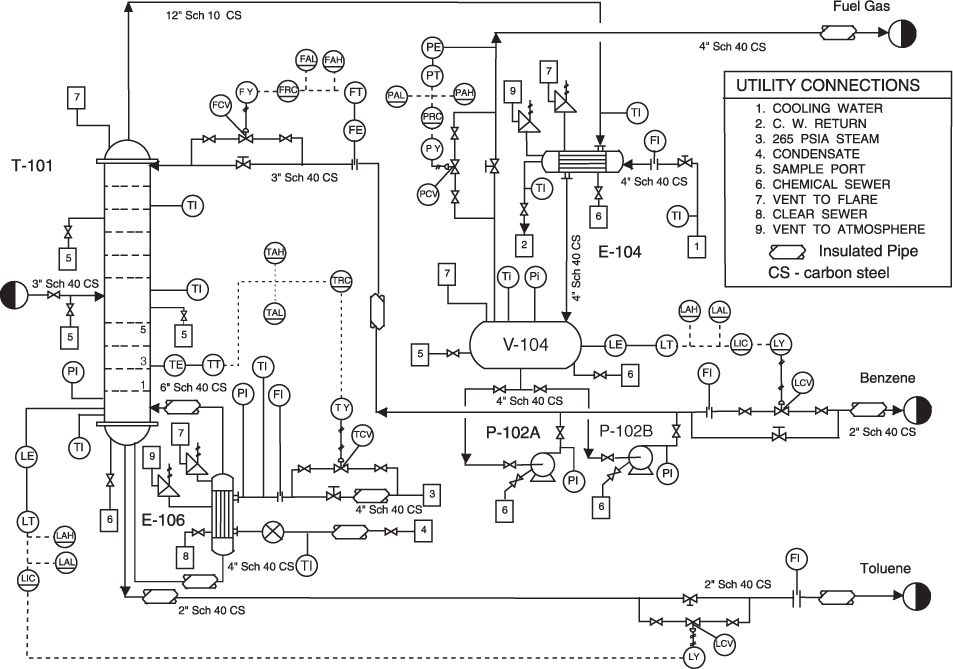
piping and instrumentation diagram
other (manufacturing fishbone diagram, molecular interaction diagram, …)
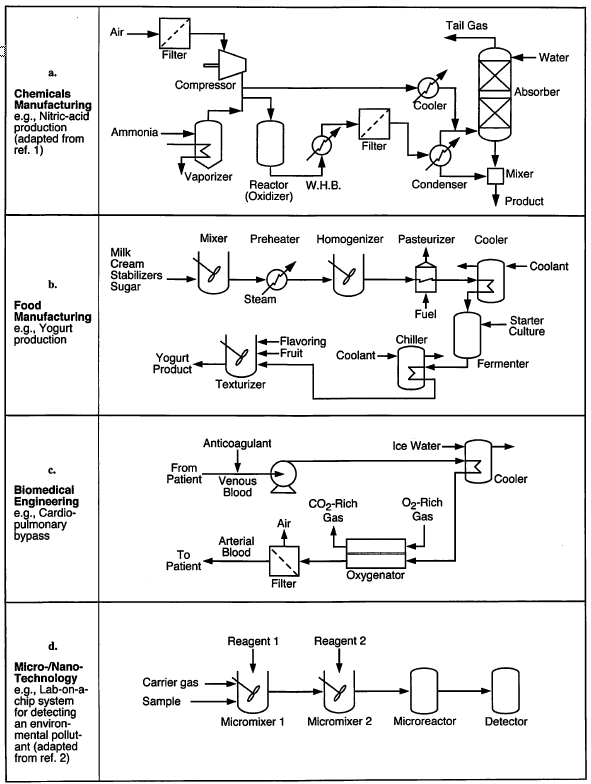
Block diagram
Includes an overview of the process, treating processes as black boxes that are used to represent either a single equipment item or a combination of equipment items that collectively accomplish one of the principal steps in the process.
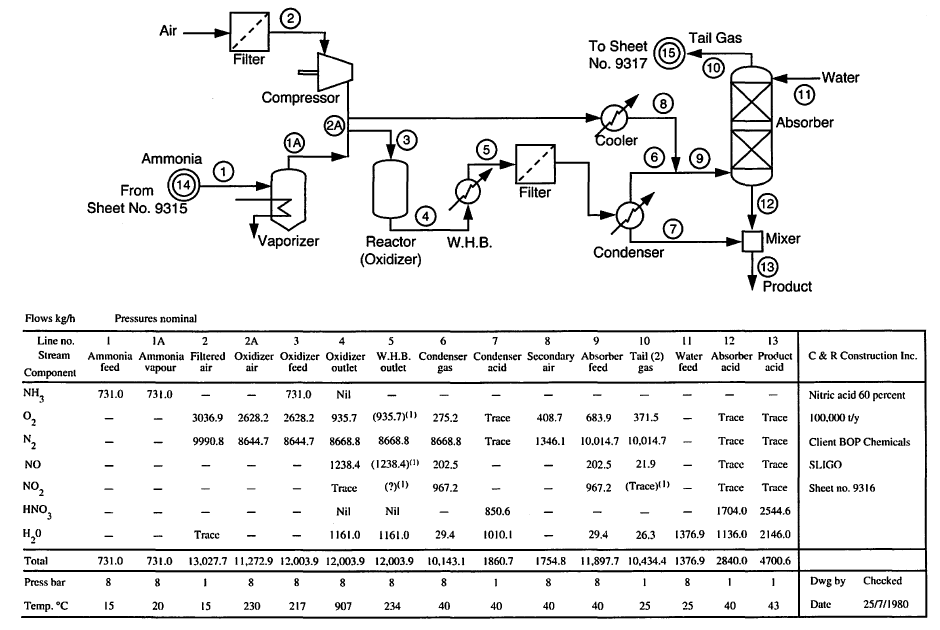
Process flow diagrams (PFDs)
Includes major unit operations (components), their interconnections, and sometimes state conditions (e.g., temperatures, pressures). It may also include a stream table.
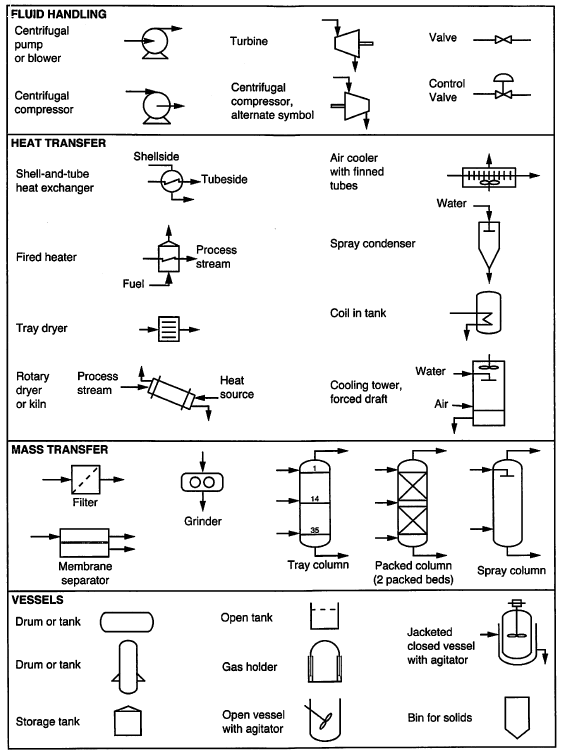
Symbols used in PFDs
Examples of simple PFDs
Other useful diagrams
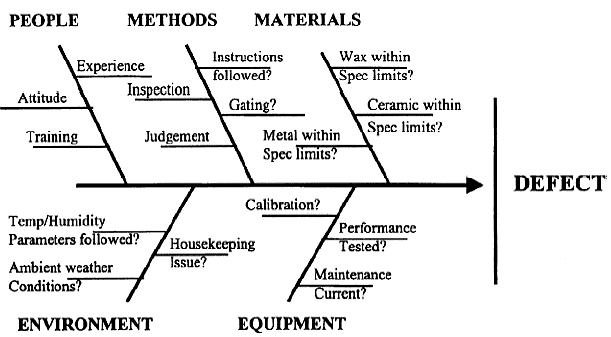
Fishbone diagram for diagnosing problems with a manufacturing process
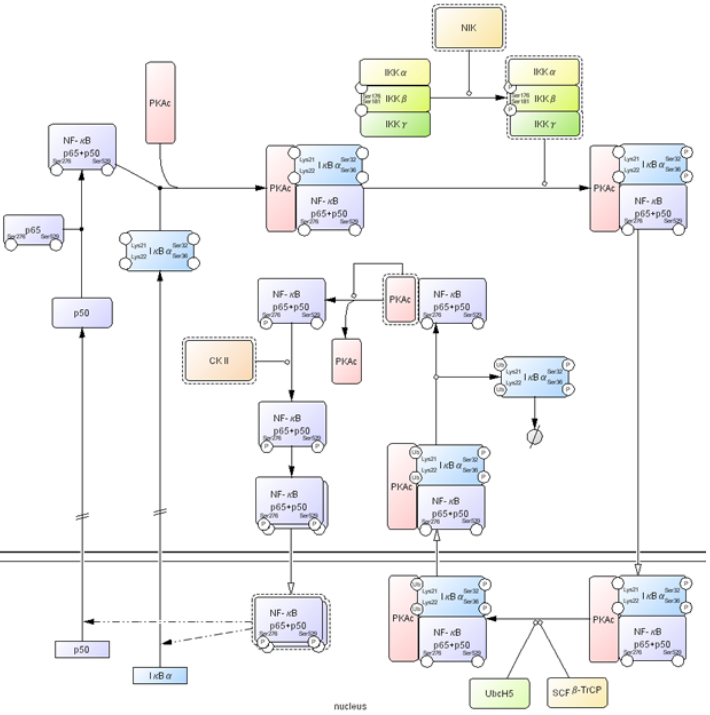
Molecular interactions diagram
Cellular metabolism diagram
Exercise: Process flow diagram (PFD)
You are analyzing the following (not necessarily well designed) process:
at the start of the process, there two fluid streams, one containing species ‘A’ at a concentration of \(\SI{2}{mol/l}\) (Stream 1) and one containing species ‘B’ at a concentration of \(\SI{3}{mol/l}\) (Stream 2)
each stream has a control valve near the start of the process
Stream 1 has a temperature of \(\SI{90}{\degree C}\) and Stream 2 has a temperature of \(\SI{70}{\degree C}\).
the two streams enter a motorized mixer
a single stream exits the mixer (Stream 3)
Stream 3 then enters a stirred tank reactor where \(\ce{n A + m B -> C}\)
the exit stream (Stream 4) enters a fluid separator
out of the separator are two streams, one containing species ‘A’ and ‘B’ (Stream 5) and the other containing species ‘C’ at concentration of \(\SI{1.5}{mol/l}\) (Stream 6)
Stream 5 goes back into the mixer
Stream 6 goes through a pump and another control valve
this stream is then cooled in a shell and tube heat exchanger using a cooled water stream that is at a temperature of \(\SI{15}{\degree C}\)
the outlet flow, now at a temperature of \(\SI{50}{\degree C}\), then enters an insulated product storage tank
Your first task it to sketch a PFD for this process.
Write down rectangles to represent the equipment
Sketch in the flow streams and connections
Write down the state-points (e.g., flow rates and temperatures) in their proper locations
Replace the rectangles with the proper symbols