|
|
MODEL APPLICATION EXAMPLE | |||||||||||||||||||||||||||||||||||||||||||||||||||||||||||||||||||||||||||||||||||||||||
|
The Goodwin Creek Experimental Watershed | ||||||||||||||||||||||||||||||||||||||||||||||||||||||||||||||||||||||||||||||||||||||||||
|
|
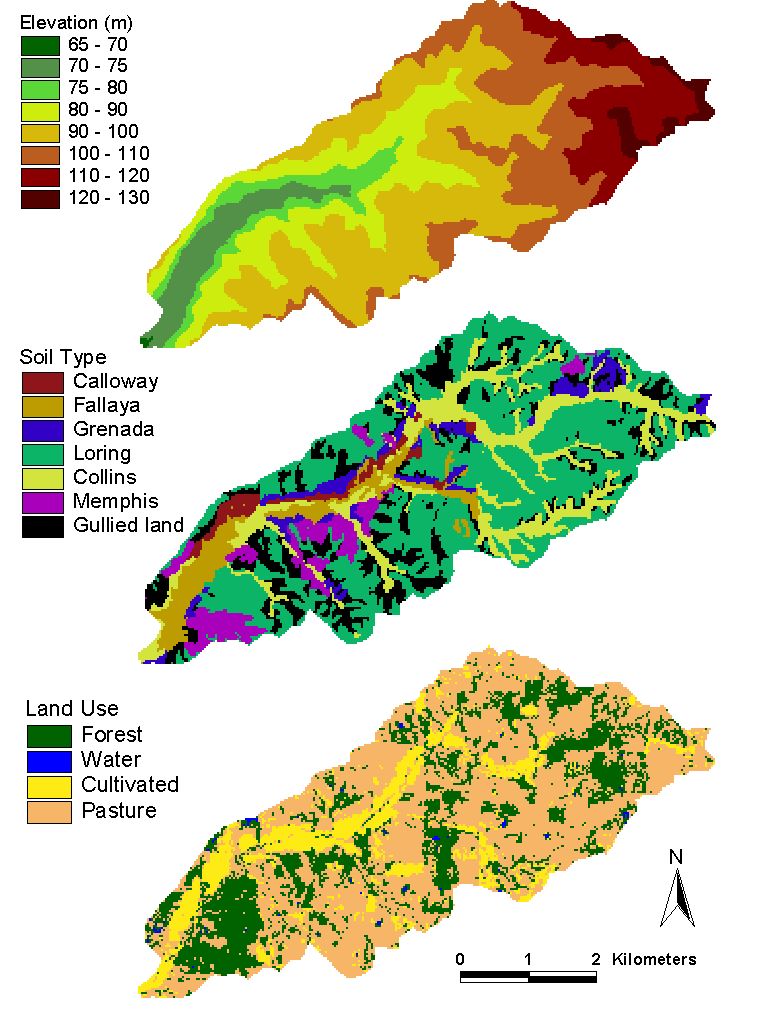
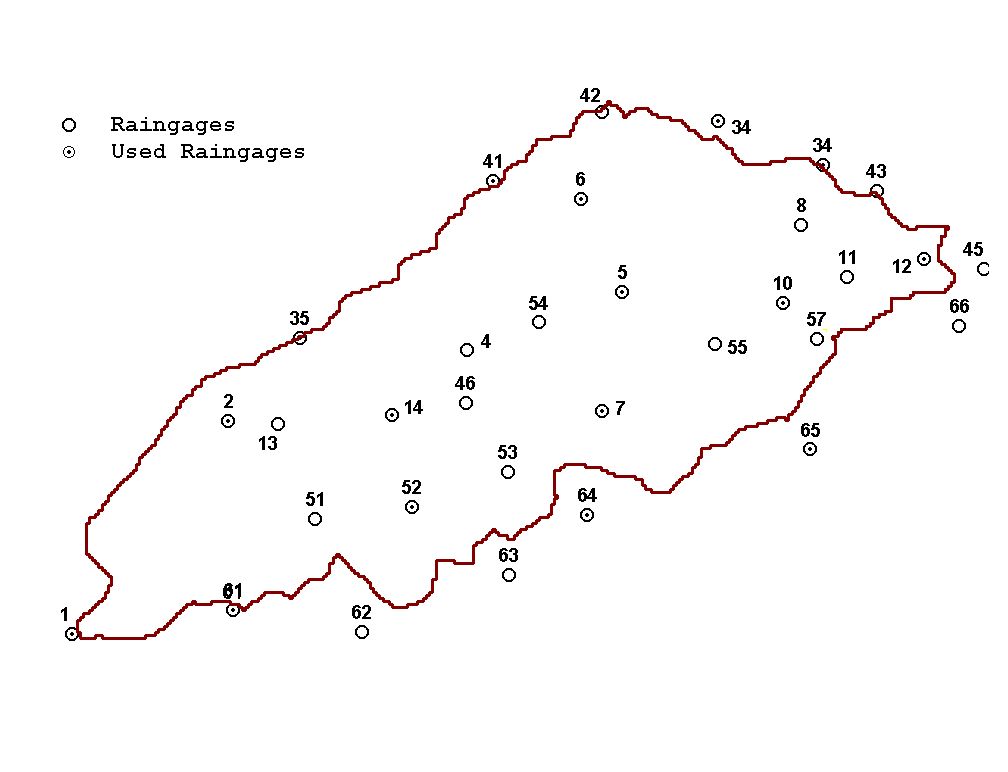
This example is taken from Rojas (2002). The model is run using data from the Goodwin Creek Experimental Watershed (21.4 km2). The site description, model set-up, hydrographs, sediment graphs and output grids time series are shown in this page. See the Input Files and Output Files pages for a detailed description on the input and output files. Goodwin Creek is located in Panola County, Mississippi. The watershed is operated by the National Sedimentation Laboratory (NSL), and it is organized and instrumented for conducting extensive research on upstream erosion, instream sediment transport, and watershed hydrology (Shields et al., 1995; Alonso, 1995; Alonso et al., 1996; Kunhle et al., 1996; Kunhle and Willis, 1998). The watershed has a database compiling runoff, sediment, and precipitation from 1981 until 1996. This database is available at the NSL web site. The Digital Elevation Model (DEM), soil type and land use maps at 30-m resolution are shown in Figure 10. Figure 10. DEM, soils and land use maps of the Goodwin Creek watershed (30-m). CASC2D-SED was calibrated for the storm event of October 17, 1981. This event began at 9:19 p.m. and had a total rainfall duration of 4.8 hours with very little rainfall preceding this event. Precipitation data was taken from sixteen rain gauges that are located within and just outside the watershed (see Figure 11). The total rainfall depth for this event varied from 66 to 78.7 mm with an average value of 73.6 mm. The average rainfall intensity was 14.7 mm/h with a maximum of 51.6 mm/h. Figure 11. Goodwin Creek Watershed rain gauge locations. The model was calibrated for event 1 depending on soil type and the LULC and according to the range of possible values found in classical sources (Rawls et al., 1983; Saxton et al., 1986; Wishmeier and Smith, 1978; USDA, 1975; Woolhiser, 1975, Woolhiser et al.,1990). The parameter set values used in the calibration run are shown in Table 2 and Table 3. Because there is no data on the soil initial moisture a uniform value was used. Table 2. Soil infiltration and erosion parameter values for the calibration run
aRawls et al. (1983); bWischmeier and Smith (1978); cUSDA (1975) texture triangle Table 3. Land use parameter values for the calibration run
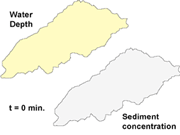
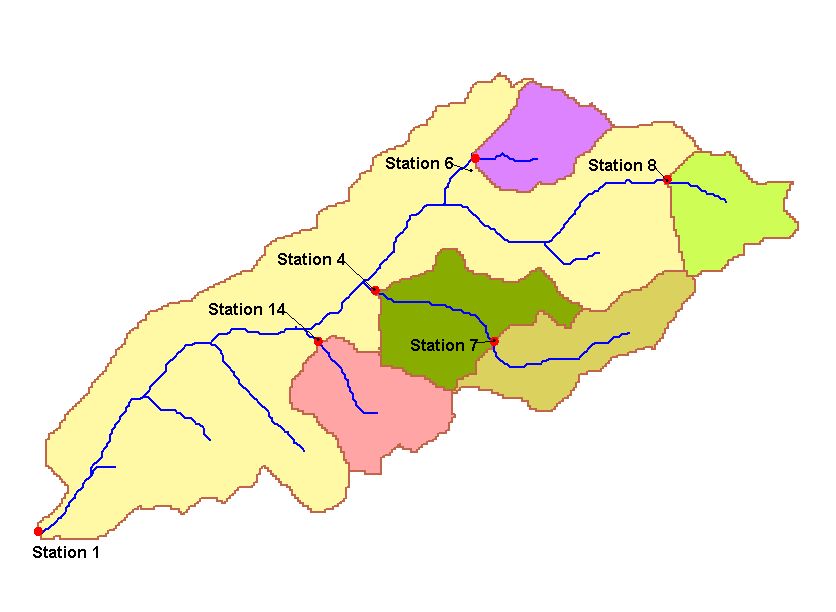
aWoolhiser (1975); bWoolhiser (1995) ; cWischmeier and Smith (1978) Simulated output hydrographs and sediment graphs are obtained at the basin outlet and at internal locations. The basin and nested sub-basins are shown in Figure 12. The hydrographs and sediment graphs corresponding to the calibrated October 17, 1981 event are shown if Figure 13 and Figure 14. Figure 12. Goodwin Creek watershed and studied sub-basins. The simulated rainfall, infiltration, overland and channel flow and sediment concentration for the October 17, 1981 event can be visualized as a time series of grids (this link launches an mpeg animation).
Home | Registration | Background | Processes | References | Example | Download | Feedback Department of Civil and Environmental Engineering - Colorado
State University |