Satellite datasets use a myriad different methods of timekeeping. Sometimes precision matters, even down to the second.
Definitions of a Second. The SI unit of a second is defined as follows [1]:
"The second, symbol s, is the SI unit of time. It is defined by taking the fixed numerical value of the caesium frequency ΔvCs, the unperturbed ground-state hyperfine transition frequency of the caesium 133 atom, to be 9 192 631 770 when expressed in the unit Hz, which is equal to s-1)."
Though this is a highly precise definition, it is not compatible with the traditional definition of the second, which is 1/86400 of a mean solar day. The particular number of oscillations chosen was selected to match observations during the "tropical year" of 1900 [2]. Thus we have the following three time scales to consider.
Expressions of time: TAI, UT1, and UTC.
- TAI (International Atomic Time)
- Measured by atomic clocks, using the precise, SI definition of a second
- Useful for scientific applications and for calculating elapsed time between events
- A continuous, linear time scale
- UT1 (Universal Time)
- Defines a second in a way that depends on the observed rotation rate of the Earth
- Useful when associating time with the Earth's rotation or movement of the sun across the sky
- UTC (Coordinated Universal Time)
- Used for civil time as a compromise between TAI and UT1
- Features the constant SI second like TAI, but requires periodic adjustment with leap seconds so that it stays close to UT1
- These leap seconds mean UTC is a discontinuous time scale. It can't be extrapolated into the future reliably given that the need for leap seconds is unpredictable beyond about a year.
UTC can be thought of as a discontinuous labeling system for TAI; e.g. a moment in TAI time is labeled with some UTC value.
Leap Seconds and Visualizing TAI, UT1, and UTC.
The relationship between the three time scales can be visualized as follows. Imagine a time scale with moving markers representing TAI, UTC, and UT1, and featuring tick marks one SI second apart. TAI and UTC march along at the same rate, one tick mark every SI second. TAI is ahead of UTC by some fixed number of seconds (27 seconds as of 2025).
UT1 marches along at a rate close to 1 tick per SI second, but is at the mercy of factors affecting the rotation rate of the Earth on its axis, including tidal friction and the distribution of mass on the planet and in its atmosphere. In modern times (until approximately the year 2020), it has moved slightly slower than UTC on average, resulting in UTC very slowly outpacing UT1. The difference between UT1 and UTC is called the DUT1 correction. Some recent values are plotted in Figure 1 below.
Click figure for a larger version
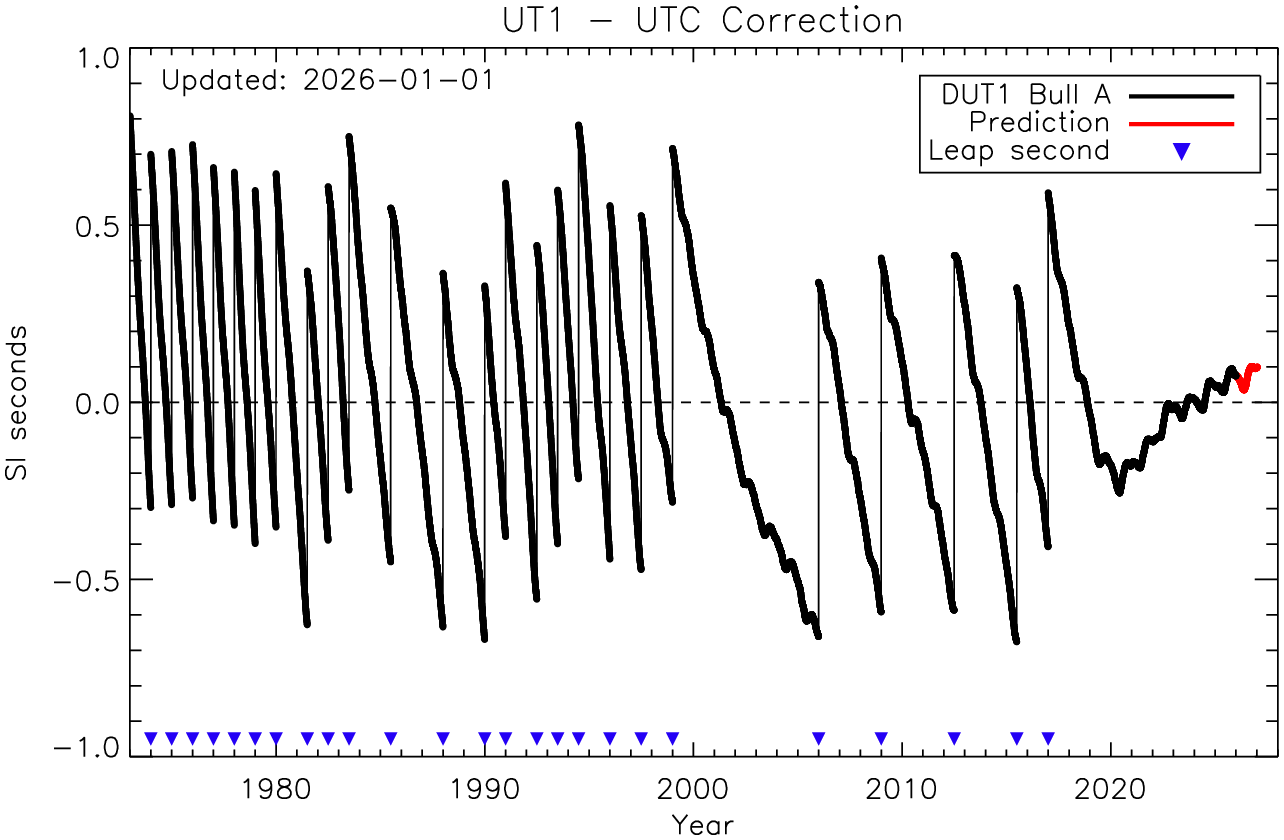
Figure 1: DUT. This plot shows the observed difference between UT1 and UTC, also called DUT1, obtained from the U.S. Navy [3] and IERS bulletins [4]. The black line is the observed difference, and the red line is a future prediction. The vertical lines, also marked by blue triangles, correspond to times when leap seconds were added.
The situation can be visualized as follows: the markers for TAI and UTC move at the same rate, with TAI ahead of UTC by a certain number of integer seconds. The UT1 marker trails UTC by some fraction of a second, moving imperceptibly slower than the first two.
At some point, imagine enough time has passed that UTC is one second ahead of UT1 (though current rules prevent the gap from becoming larger than 0.9 seconds). The fix is to effectively pause UTC for one second so that UT1 can catch up to it! This is exactly what the leap second does: it stretches 23:59:59.0 to 00:00:00.0 into two seconds, by adding 23:59:60. (Remember, at this point, TAI continues along unaffected, so it becomes one second further ahead of UTC when the transition is complete.)
Now the timeline is as follows: UTC and UT1 are on top of each other. TAI and UTC march along at the same rate, with TAI 28 seconds ahead. Yet UT1 is moving imperceptibly slower, and will eventually fall another second behind UTC if given enough time. When the difference becomes large enough another leap second will be announced and added.
Over the last 50 years, however, the Earth has been trending toward faster rotation (acting against the longer-term trend toward slower rotation due to tidal friction). After removing the leap seconds from the DUT1 record (Figure 2), we can calculate the time rate of change of this modified DUT1 (Figure 3) which is directly proportional to the rotation rate. Positive values indicate periods where days are shorter than the 86400 SI second baseline, and the value tells us how much shorter. The shortest day ever recorded occurred on 2024-07-05, and was about 1.66 milliseconds less than 24 hours in length [3,4,5].
There are many theories for why this is happening; it is possible, for example, that the rapidly-melting polar ice caps may be partially responsible for this change by increasing the Earth's oblateness [6]. Regardless of the reason, by about 2020 the faster rotation of the planet resulted in UT1 seconds ticking faster than the caesium-based SI seconds that drive UTC and TAI. As a result, UT1 began to move ahead of UTC. If this continues, one solution would be to subtract a leap second rather than add one, so that 23:58:59.999... would be followed by 00:00:00.0. This would allow UTC to suddenly jump forward, closing the gap with UT1 (and reducing the gap with TAI). It remains to be seen, however, if a negative leap second will be needed. A negative leap second is often viewed unfavorably because there has never been one to date, and there may be software that fails when exposed to it.
Click figure for a larger version
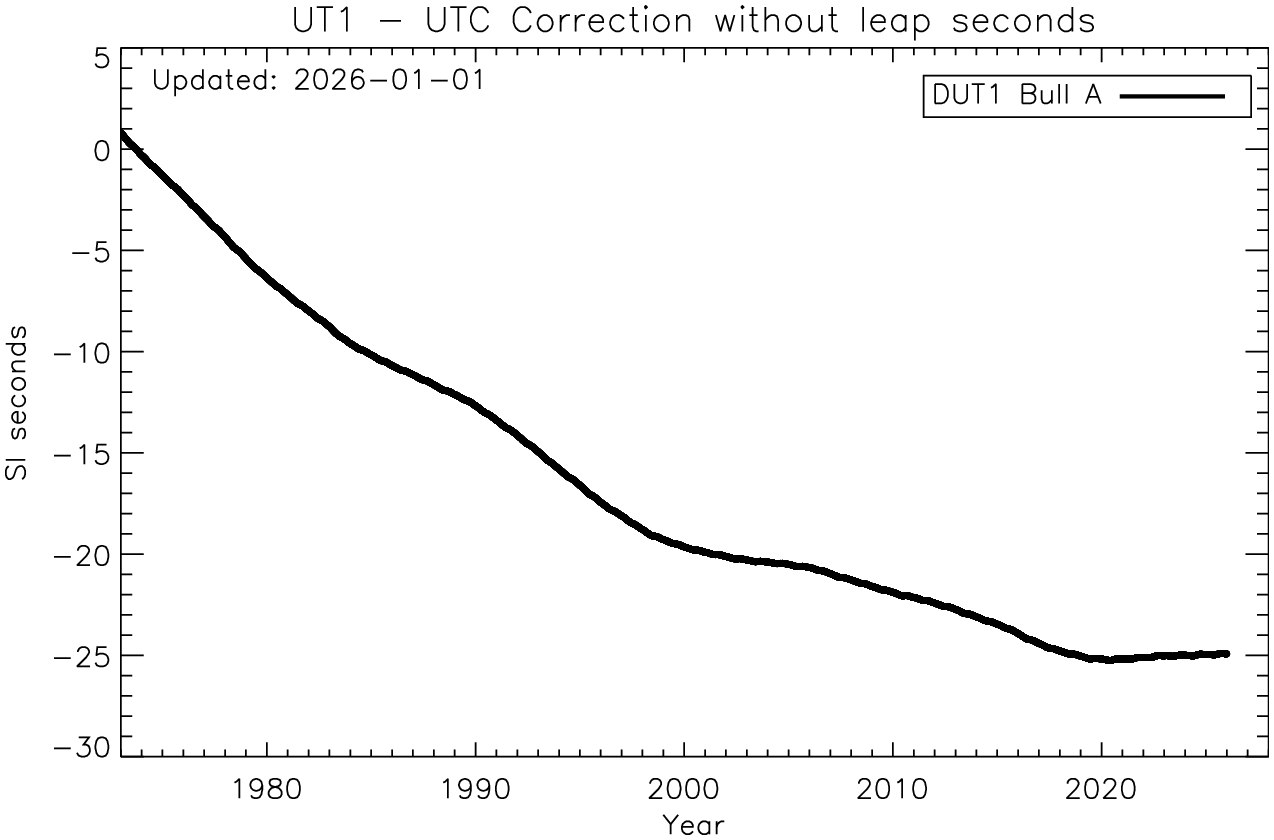
Figure 2: DUT1 with leap seconds removed. In this plot, the leap seconds have been "unfolded". It thus shows the UT1 minus UTC difference that would have occurred if no leap seconds were added since 1972.
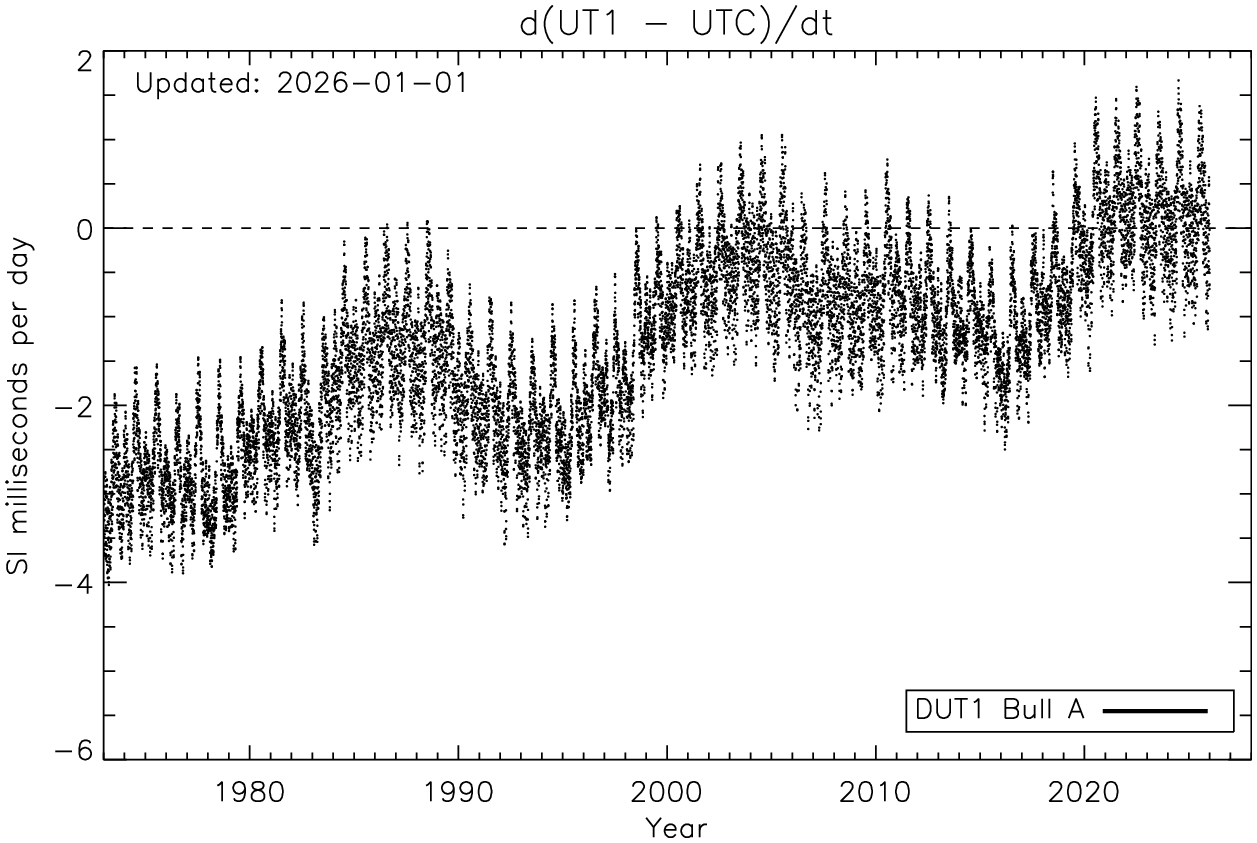
Figure 3: Time rate of change of DUT1. Here the time rate of change of DUT1 is shown in units of milliseconds per day, with each dot representing one day. It is no coincidence that the maximum value on this plot corresponds nearly exactly to the length of shortest day ever recorded in July 2024 (with respect to the 86400 SI second baseline).
Updated January 2026
References
[1] The international system of units (SI), 9th edition, BIPM, 2019, https://doi.org/10.59161/AUEZ1291
[2] Markowitz, W., R. G. Hall, L. Essen, and J. V. L. Parry, 1958: Frequency of cesium in terms of ephemeris time. Phys. Rev. Lett., 1, 105–107, https://doi.org/10.1103/PhysRevLett.1.105
[3] U.S. Navy DUT1 data: https://maia.usno.navy.mil/ser7/finals.all
[4] International Earth Rotation and Reference Systems Service (IERS) bulletins: https://www.iers.org/IERS/EN/Publications/Bulletins/bulletins
[5] space.com: Earth will spin faster today to create 2nd-shortest day in history
[6] Shahvandi, M. K., S. Adhikari, M. Dumberry, S. Mishra, and B. Soja, 2024: The increasingly dominant role of climate change on length of day variations. Proc. Natl. Acad. Sci. U.S.A., 121, e2406930121, https://doi.org/10.1073/pnas.2406930121