Interpreting the CAN data for a 2010 Toyota Camry
A Racelogic VBox 3i that is capable of recording messages from an automotive CAN network. However, the CAN messages need to be decoded to be used. To do this, Racelogic may supply CAN databases for some suppliers, but not every message is included or known. Therefore, a procedure is described on this page to decode messages based on physical data.
First, a goal needs to be stated. For this case, the vehicle speed signal used by the on-board event data recorder (EDR) was of interest and the ID was not available. If this signal is known, then an independent (3rd party) verification of the accuracy of the EDR data stored on Toyota vehicles can be performed. The data from the Toyota EDR built into the air bag control module is available using a Bosch Crash Data Retrieval System.
Overview
- Program known (test) signals into a CAN capable data recorder
- Record all CAN data while performing a dynamic driving test
- Filter and examine the recorded CAN data
- Compare plots of decimal equivalent CAN data to external measurements
Detailed Example
A CAN database file from Racelogic gave the first clues as to what to look for. The database file provided by Racelogic included the following information:
| Parameter Name | CAN ID (Decimal) | CAN ID (Hex) |
|---|---|---|
| Fuel | 920 | 398 |
| ThrottlePedal | 705 | 2C1 |
| WSPD_4 | 178 | 0B2 |
| WSPD_3 | 178 | 0B2 |
| WSPD_2 | 176 | 0B0 |
| WSPD_1 | 176 | 0B0 |
| PRND | 948 | 3B4 |
| SteeringAngle | 37 | 025 |
| CurrentGear | 464 | 1D0 |
| Engine Speed | 708 | 2C4 |
| Brake_Pedal | 548 | 224 |
| ThrottlePedal2 | 705 | 2C1 |
| ParkingBrake | 560 | 230 |
| AirCon | 896 | 380 |
| Odometer | 1553 | 611 |
It was discovered that not all of these data were present on the CAN bus of a 2010 Toyota Camry and extra parameteres were present.
VBox Setup
The VBox 3i was set to record all channels at 100 Hz. An inertial measurement unit (IMU) was connected and the channels above were programmed into the Vehicle Communications Interface (VCI). The VBox was connected to the vehicle through an OBD-II breakout box from DG Technologies. The Vbox unit is actually powered through the ODB-II port, eliminating the need for an external power cable. A tape switch was placed on the brake pedal and wired into the Din port of the VBox.
Driving Test
The vehicle driven to 50 mph, the cruise control was set, followed by a hard-braking event that invoked the ABS system. After the vehicle was stopped, it was moved over on the shoulder of the road by turning the wheel and driving slowly. This is important because the steering wheel angle signal shows this feature.
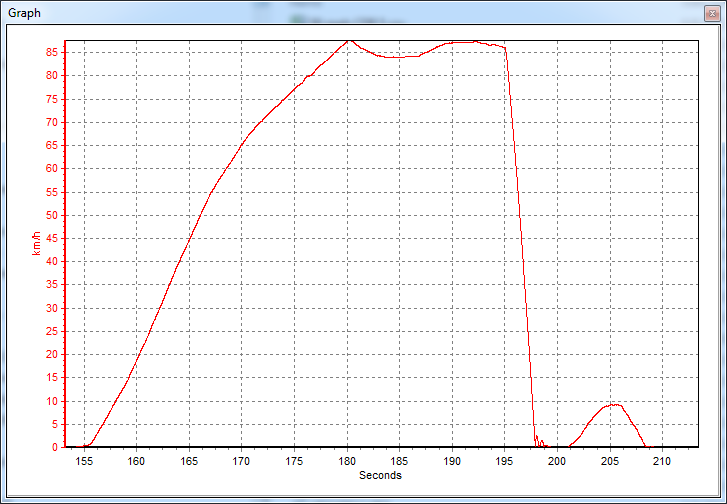
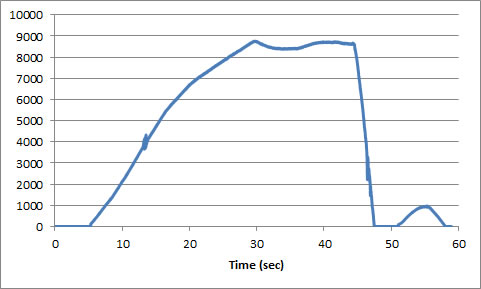
A plot of the VBox Data (below) shows a distinct and unique shape of the speed profile. The curve shows a normal to aggressive acceleration to a speed where the throttle was released and the cruise control was set for s couple seconds. The brakes were applied aggressively at a time corresponding to nearly 195 seconds and the vehicle was brought to a complete stop. After a brief pause, the vehicle was moved over on the shoulder and the run ended.
Some of the parameters recorded on the VBox through the CAN bus were also present on the record. The following sequence of images shows the different signals superposed on the speed trace.
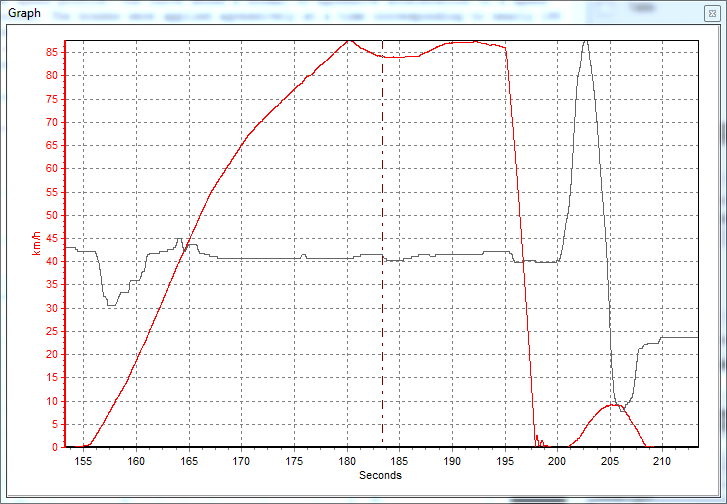
This image shows the throttle position signal (Hex 2C1). The spike indicated with the blue hand-drawn arrow was intentional, as the driver applied a quick pulse to the throttle pedal to create the feature in the record.

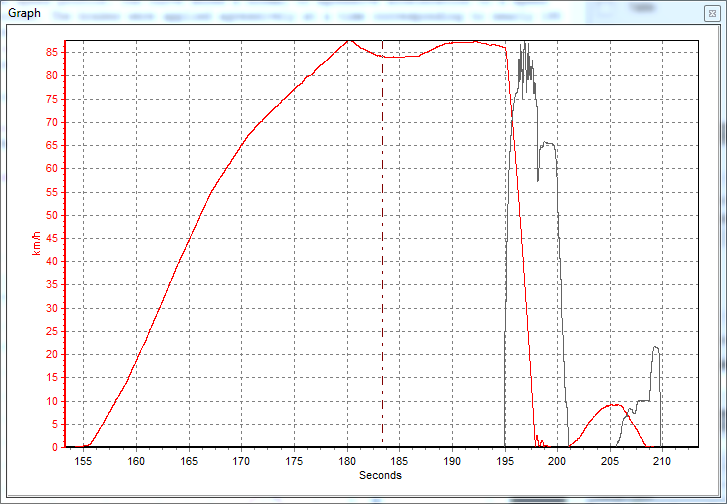
The following trace shows the Steering Wheel signal superposed on the VBox 3i speed trace. Notice the steering action at the end when the vehicle was moved to the right of the roadway.
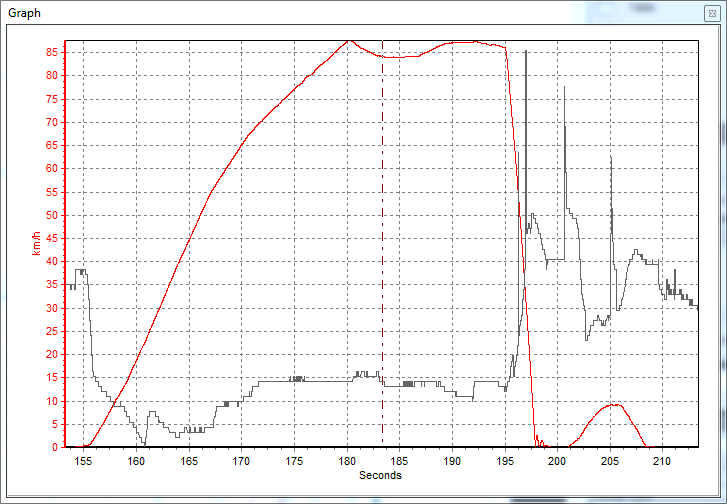
The following graph shows the brake pressure signal from CAN superposed with the speed signal.
Finally, the following signal was represented as a throttle related signal. It appears the number is negative or decreases with speed or power, perhaps a manifold pressure sensor.
While these graphs are encouraging, the vehicle speed CAN message used for the EDR is not available. Therefore, the CAN record needed to be examined to locate that record.
Examining the CAN Record
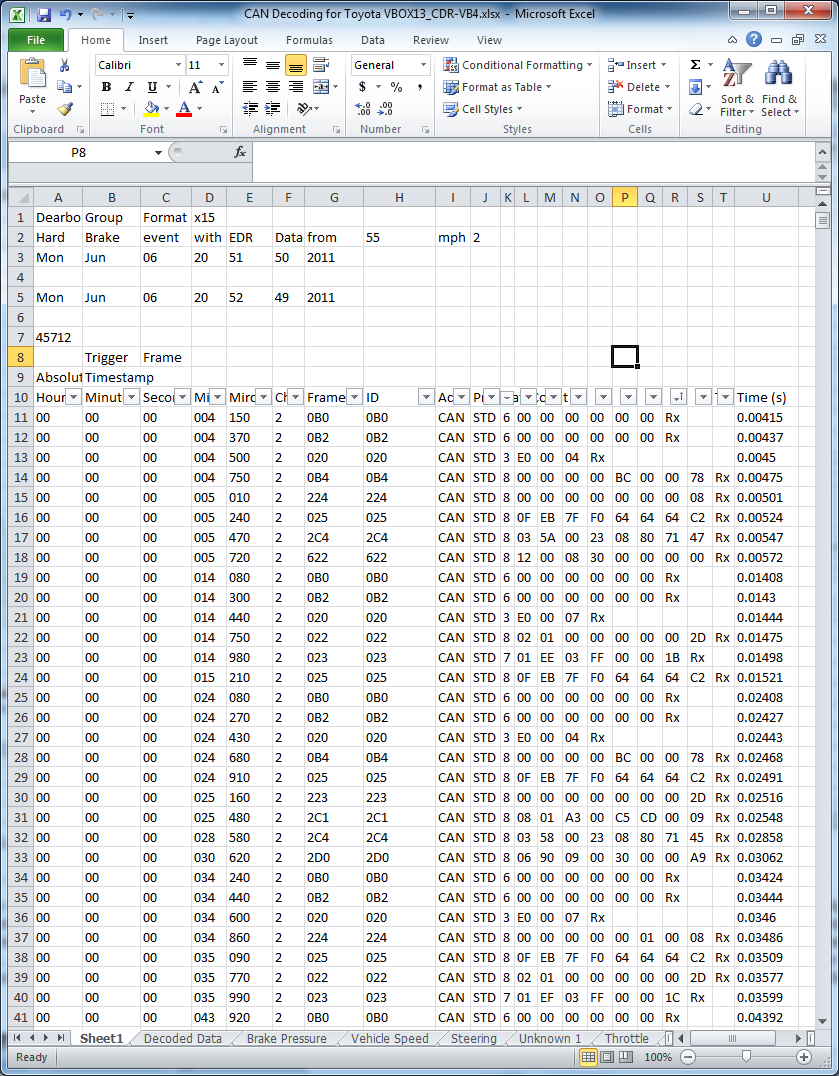
All communications were recorded using a Dearborn Group Gryphon S3 and the Hercules software over a wireless link. The data was buffered and saved on a host computer as a CSV file. Finally, using the text import feature of Excel with commas, colons, and spaces as delimiters, the file was imported as text. A screenshot of the Excel sheet with the imported data is shown below. The timestamp from the text file has the format HH:MM:SS:MILLIS:MICROS. Therefore, time has to be reconstructed as =hours*3600+minutes*60+seconds+milliseconds/1000+microseconds/1e6. This result is shown on the right hand side of the imported data.
Once the data was imported in Excel, it was filtered. Through the filter function, data was examined in a methodical fashion. Specifically, the CAN ID field provided different elements to examine data methodically. The following table summarizes results from the analysis of each of the CAN ID's that are present on the 2010 Toyota Camry CAN bus (500kbps - 11 bit identifier).
| CAN ID (Hex) | CAN ID (Dec) | Data Length | Description | Rate (seconds) | Notes |
|---|---|---|---|---|---|
| 020 | 32 | 3 | Unknown | 0.01 | Not Data change |
| 022 | 34 | 8 | Steering like signals | 0.02 | Bytes 1-2 and 8 change data |
| 023 | 35 | 7 | Unknown | 0.02 | Bytes 1-2 and 7 change |
| 025 | 37 | 8 | Steering Data | 0.01 | Signed data |
| 0B0 | 176 | 6 | Wheel Based Speed 1 &2 | 0.01 | Bytes 1 and 2 give a wheel speed |
| 0B0 | 176 | 6 | Wheel Based Speed 1 &2 | 0.01 | Bytes 3 and 4 give a wheel speed |
| 0B2 | 178 | 6 | Wheel Based Speed 1 &2 | 0.01 | Bytes 1 and 2 give a wheel speed |
| 0B2 | 178 | 6 | Wheel Based Speed 1 &2 | 0.01 | Bytes 3 and 4 give a wheel speed |
| 223 | 547 | 8 | Unknown | 0.03 | Little data changes |
| 224 | 548 | 8 | Brake Pressure | 0.03 | Bytes 5 and 6 |
| 2C1 | 705 | 8 | Throttle Pedal | 0.99 | Byte 7 is throttle |
| 2C4 | 708 | 8 | Engine Speed | 0.02 | Bytes 1 and 2 |
| 2D0 | 720 | 8 | Unknown | 0.03 | No time trends |
| 380 | 896 | 8 | Unknown (Air Cond) | 1 | Little data changes |
| 381 | 897 | 8 | Unknown | 5 | Little data changes |
| 383 | 899 | 8 | Unknown | 2 | All zeros |
| 38A | 906 | 5 | Unknown | 2 | All zeros |
| 398 | 920 | 2 | Fuel | Aperiodic | |
| 399 | 921 | 5 | Unknown | 1.0 | Switch like data |
| 3A0 | 928 | 8 | Shifting? | 0.1 | |
| 3A1 | 929 | 8 | 1.0 | No changing data | |
| 3B0 | 944 | 6 | 1 | No changing data | |
| 3B1 | 945 | 8 | 1 | No changing data | |
| 3B3 | 947 | 3 | Throttle 2 | 0.5 | |
| 3B4 | 948 | 8 | Unknown | Aperiodic | |
| 3B7 | 951 | 8 | PRND | Aperiodic | All zeros (Car was in drive the whole time) |
| 423 | 1059 | 1 | 1 sec | All zeros | |
| 440 | 1088 | 8 | 0.2 | All zeros | |
| 442 | 1090 | 8 | 0.2 | No changes | |
| 4C1 | 1217 | 8 | 1 | No changes | |
| 4C3 | 1219 | 8 | 1 | No changes | |
| 4C6 | 1222 | 8 | 1 | No changes | |
| 4C7 | 1223 | 8 | 1 | No changes | |
| 4DC | 1244 | 8 | 1 | No changes | |
| 4DD | 1245 | 8 | 1 | No changes | |
| 610 | 1552 | 8 | Vehicle speed | 0.5 | Byte 3 is vehicle speed (raw kph). Static bits on bytes 4 and 5 |
| 611 | 1553 | 8 | 1 | Switch bit on Byte 2 only. All others static | |
| 620 | 1568 | 8 | Switch data | 0.3 | Switched while moving. Byte 4 changes from 55 to 56. |
| 621 | 1569 | 8 | 1 | No changing data (mostly zeros) | |
| 622 | 1570 | 8 | 1 | No changes | |
| 624 | 1572 | 8 | 1 | No changes | |
| 630 | 1584 | 8 | 1 | All zeros | |
| 638 | 1592 | 8 | 1 | All zeros |
Blanks in the above table means the data is not known or of concern for this particular application. Further work is needed to decode these items.
Speed Measures on the CAN
Once all the message ID's were skimmed for data size and frequency of repetition, the actual data needed to be decoded. The time column was pasted (as values) into the first column of a new sheet.
In the original VBox capture, there was something awry, because CAN based speed data was not recorded. Therefore, the hex ID of 0B0 was examined using bytes 1 and 2. The data columns were selected, and the values were pasted as values in a new column.
The data in Message ID 0B0 in bytes 1 and 2 were combined using the =concatenate() command in Excel. Then the hex words were translated to decimal using the =hex2dec() command. Then a time and value column existed from which to plot the values in a scatter chart. The result is as follows:
The shape of the graph matches the VBox GPS based speed record, but the scale was off. The maximum speed from GPS was around 86 kph. The peak on the above graph was 8600; therefore the scaling factor is likely 0.01 to convert the decimal value to an engineering units. It turns out that the next two bytes (3 and 4) provide a similar signal trace. Also, CAN ID 0B2 gives two more speed records. Therefore, the Wheel Speed data originally provided by Vbox was confirmed. However, the Vbox was not receiving this channel during the first runs. This was fixed by applying the correct data length code (6) in the Vbox Tools setup for the Vehicle CAN Interface (VCI) tab.
The overall vehicle speed signal from the transmission sensor was still not known. So a similar procedure of selecting each CAN ID and plotting the bytes that change with time on a graph. This method identifies dynamic signals that change with driver input and speed. The other speed-like signal was CAN ID 610 (hex) and it had a refresh rate of 0.5 seconds. This corresponds to the requirement of NHSTSA Rule 47, Part 563 for vehicle speed.
A plot of all speed records are shown below. The data were synchronized using the brake pedal sensor signal that was captured with the CAN capture tool (Gryphon S3) and the VBox 3i. The time scale on this graph focused on the aggressive braking phase of the speed record.
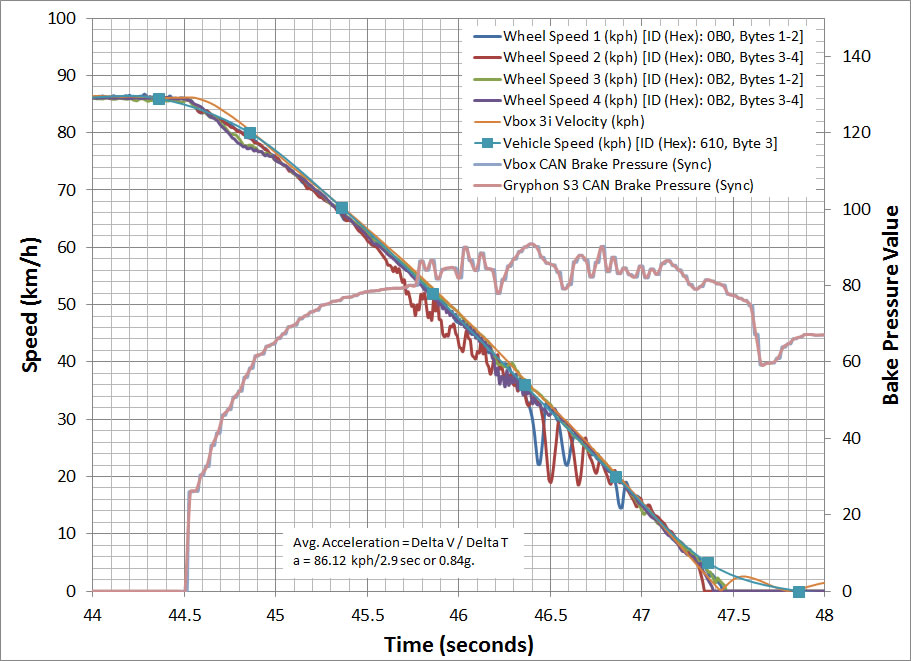
From these data it was seen that the ABS system was active since the wheel speed changes. The speed sensors for the various wheel speeds underreported the speed during phases of the hard braking event. On this graph the difference between the on-board (CAN) speeds and the VBox 3i speed was small. The original data file for this graph is in Excel format: CANDataForToyota.xlsx (1.73Mb)
From this experiment, it can be seen that the CAN data was consistent with the external measurement signal. The source of reliable data from built in sensors may provide inexpensive data sources for experimental validation for vehicle dynamics simulation routines.