This article explains and presents correlated measurements of a 2009 Freightliner truck-tractor with a Detroit Diesel Series 60 Engine controlled by a DDEC6 controller. A correlated measurement is one that is synchronized in time. The time synchronization is performed by oversampling the J1939 bus traffic.
When performing an accuracy assessment of the digital data stored on heavy trucks, data from reference instrumentation are compared to the reports generated by the diagnostic software for the heavy vehicle. Taking the data presented below, we can demonstrate how to synchronize the times between the report and the reference instrumentation.
Background
A paper assessing the timing and synchronization of different parameters from a DDEC 5 controlled truck was presented at the 2013 SAE World Congress. The paper, Timing and Synchronization of the Event Data Recorded by the Electronic Control Modules of Commercial Motor Vehicles - DDEC V, used a VBox as the reference instrumentation and showed that some of the switch events (brake and clutch) can be delayed over 1 second. This paper provides much of the inspiration for this work.
Objective
Robust data sets that time correlate as many measurements as possible are rare. Therefore, a significant objective of this site is to host the data collected. The J1939 data bus was used to synchronize the data. The vehicle was measured even during standard normal operations like reversing and hooking up to a trailer. The purpose of these measurements was to determine the response of the vehicle speed sensor signals and look for noise in the signal due to the mechanical impact from coupling to a trailer.
The following table lists the instruments used and their purpose.
| Device | Purpose |
|---|---|
| HBM eDAQ Field Computer System |
Measures analog signals (Vehicle Speed Sensor Output, Brake Pressure) Measures switch input from pressure switch on brake pedal. Measures motion from eGPS-200. Measures CAN from J1939 bus. Measures serial from J1708 bus. |
| Racelogic VBox 3i |
Measures motion Transmits data in a CAN message onto J1939 bus for correlation Measures switch input from pressure switch |
| NeoVI Yellow |
Monitors and records all bus traffic from the 9-pin Deutsch connector in the cab (both J1939 and J1708). |
| DGTech DPA5 | The RP1210 Device used to access DDEC data with a PC. |
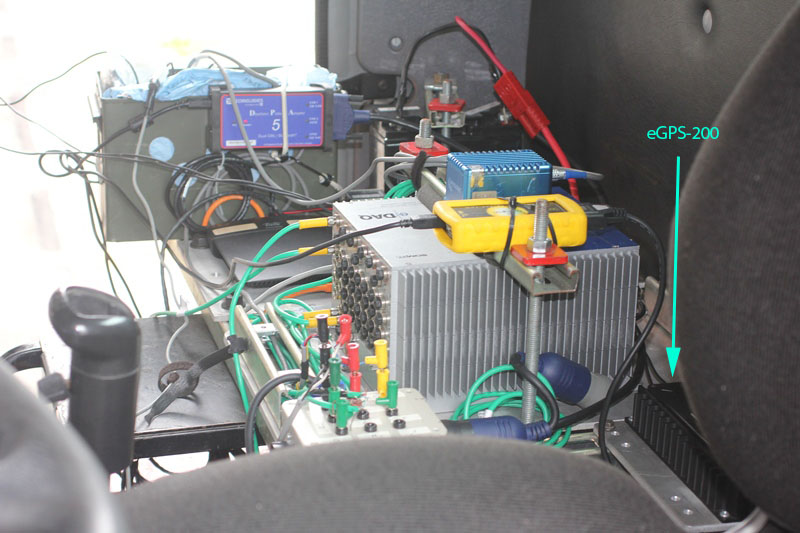
A photograph of the instruments mounted in the cab of the truck is shown below.
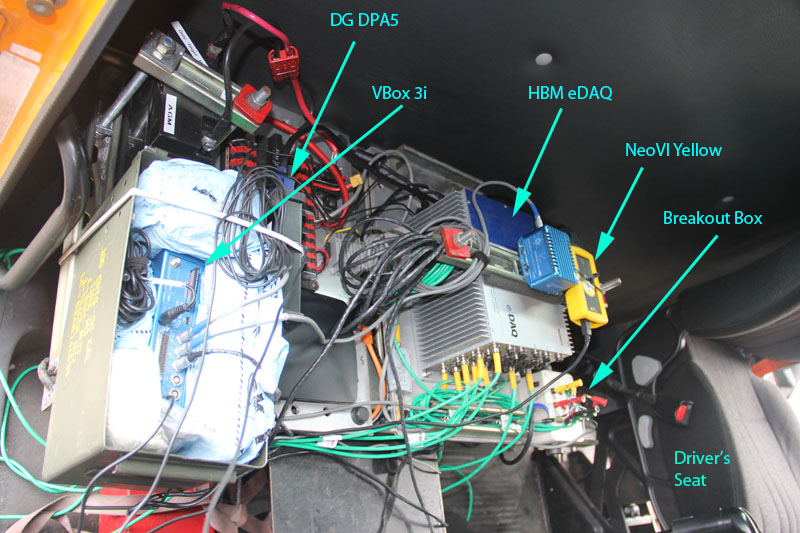
This article will explain the different settings and link to the data files.
Test Procedure
As a brief overview, the following actions were performed:
- Acquire a truck. In this case it was a 2008 Freightliner with a Detroit Diesel Series 60 Engine and A DDEC 6 controller. The tractor had a single drive axle. It was tested as a bobtail, with 1 trailer and with 2 trailers. Recording of hooking up to the trailers was also captured.
- Assemble the instrument cluster. A steel frame with aluminum plates was fabricated to house all instruments. The enabled the programs nd instrumentation setup outside the test vehicle and a relatively quick installation of all the instruments.
- Connect the test leads to the Vehicle Speed Sensor.
- Connect the pressure transducers to the air lined feeding the service side of the brake chambers.
- Mount the GPS antennas on the roof of the cab.
- Baseline the system in DDEC Reports and get a list of parameters from DDDL software.
- Drive a battery of tests and obtain DDEC Reports after each test.
Instrumentation Setup
eDAQ Setup
One large (495 MB) file contains most of the data from the eDAQ: eDAQ-DDEC6Testing.sie. All the runs are contained within that file. A program called InField is needed to read the .sie file and can be downloaded from the Somat section of the HBM web site. The test setup file for the eDAQ is eDAQ Setup File.tce and uses the Somat TCE software to setup the eDAQ. A text version of the eDAQ setup is also available as eDAQ Setup File.txt.
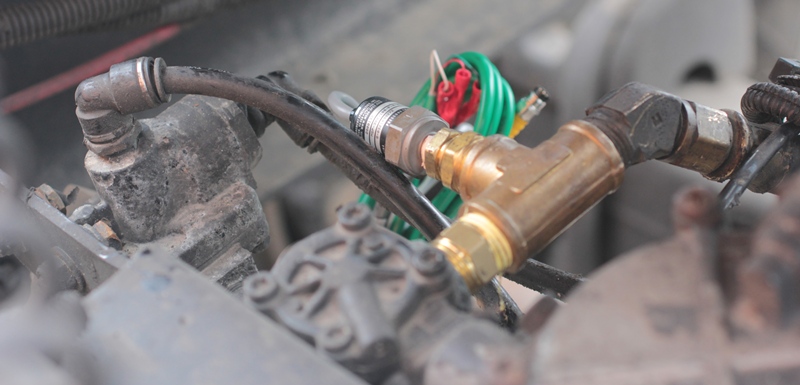
Pressure Transducers
The pressure transducers were mounted in the service brake lines. The front brake is shown below.
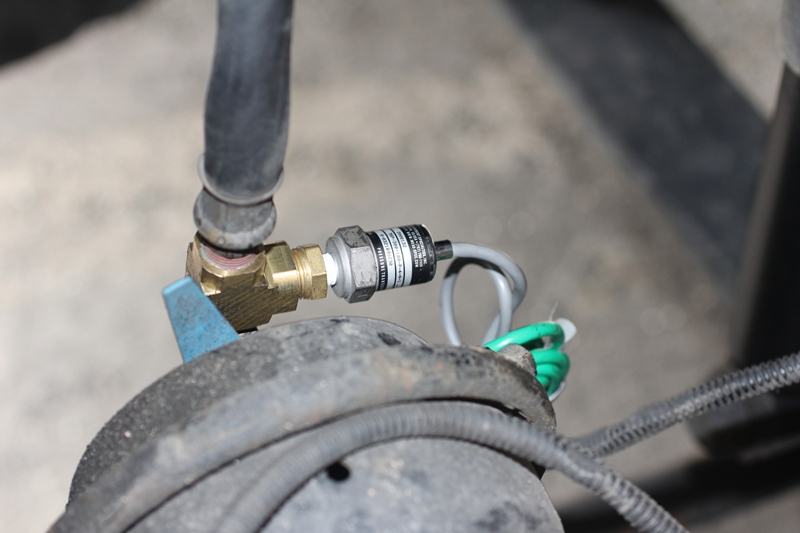
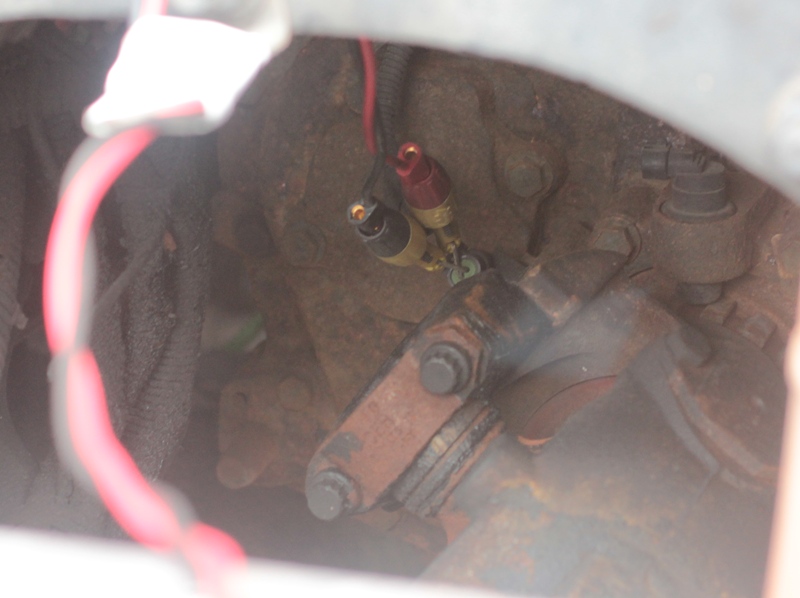
The rear brake pressure transducers were mounted near the valves as shown below.
Each Pressure transducer was an MSP 300 from Measurement Specialties. The particular model was a MSP-300-100-P-4-A-1 which means it measures 0-100 psi, take 8-30 V as supply, outputs 1 - 5 V to cover the full range, and has a 2 ft lead wire. These parameters were used in the eDAQ setup so engineering units of PSI were recorded.
Vehicle Speed Sensor
The Vehicle Speed Sensor is mounted to measure the changes in magnetic field caused by a ring of rotating teeth. It is mounted on the rear of the transmission. To measure the raw signal, the wires were tapped with some insulation piercing wire probes as shown below. Care was taken to ensure the wires did not wrap around the drive train or exhaust. Twisted leads were used to reduce the effect of electromagnetic interference. This approach will lead to corrosion and should not be done on trucks that will be in service.
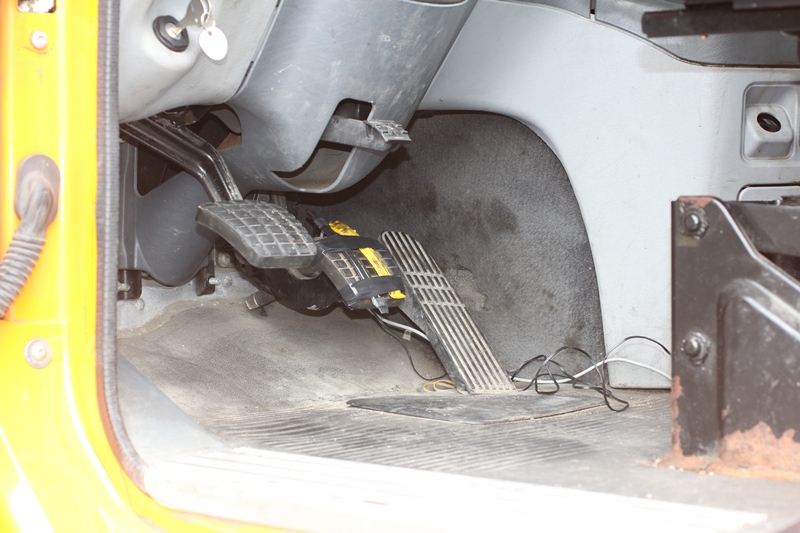
Tape Momentary Switches
Tape or pressure switches were mounted on the brake pedal (and later one was moved to the clutch pedal) to obtain a reference when the brakes were first contacted. This measurement can help determine time delays from when the pedal was first contacted to when the switch data shows up on the networks to when the value is reported in DDEC Reports. A photograph of the tape switches is shown below. The yellow switch is monitored by the VBox 3i and the black switch is monitored by the eDAQ digital input.
eGPS-200
The eDAQ used an eGPS-200 with Real-Time Kinematics to measure the 6 degrees of freedom of motion of the cab. The unit is capable of determining GPS based speeds at 200Hz. It uses 2 antenna located on the roof of the cab and an inertial measurement unit shown in the photo below.
VBox 3i
The Racelogic VBox 3i is a 100 Hz GPS based motion sensing device. It also uses an inertial measurement unit to filter GPS signals. It has the ability to transmit its data as CAN messages back onto the J1939 bus. Provided the bus load is capable of absorbing the extra information, this strategy is a good way to synchronize the external reference data to the data onboard the truck. The J1939 bus is recorded with a common instrument and it will contain all truck network data and the selected VBox data (usually CAN IDs 0x301, 0x302, and 0x303. The VBox Tools software is useful in visualizing the data and plotting results. The .vbo file format from the VBox is in plain text and can be imported into Excel.
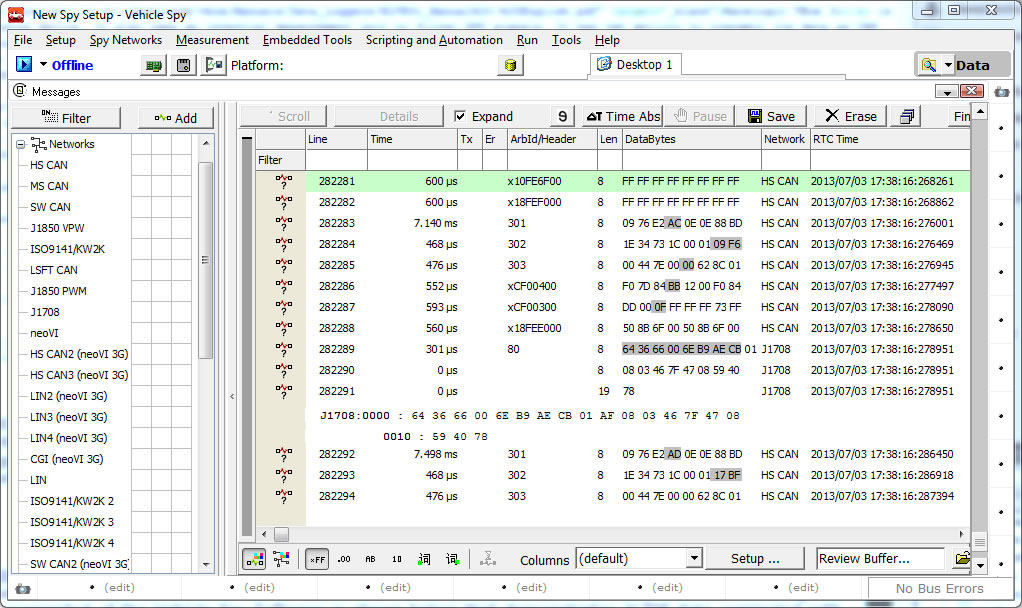
NeoVI Yellow
Intrepid Control System's NeoVI Yellow along with the Vehicle Spy software provided the network data collection solution used for this study. The feature most useful in the NeoVI is the ability to record both J1939 (CAN) and J1708 (Serial) onto the same log file with a common timestamp. A screenshot of the Vehicle Spy Software is shown below that demonstrates J1708 data co mingled with J1939 data (extended IDs) and VBox data (IDs 301,302, and 303).
PC for Diagnostics
A laptop with DDEC Reports and Detroit Diesel Diagnostic Link (DDDL) is needed to interface with the DDEC 6 on the truck. DDEC Reports is now a free download. While Detroit Diesel pushes the Nexiq, any RP1210 device will work as the interface between the computer's USB port and the vehicle networks. DG Tech's DPA 5 was used for this project.
The DDEC reports were pulled as a baseline for the tests. The raw file is in Detroit Diesel's .XTR format and DDEC Reports can print a PDF.
Test Data
All runs described below are contained in the 447-MB eDAQ-DDEC6Testing.sie file.
A 1.6-MB zip archive of all the DDEC Reports and their exported files is also available.
An 11-MB zip file with all the VBox data can be downloaded.
All vehicle network captures are contained in a 48-MB zip archive.
The following table describes the tests performed and the data files recorded during those tests. The file links in the table below are the original files and have not been truncated. Therefore, some file sizes may be large and a good Internet connection may be necessary.
Speed Traces
| Run | Speed Trace from VBox | Notes |
|---|---|---|
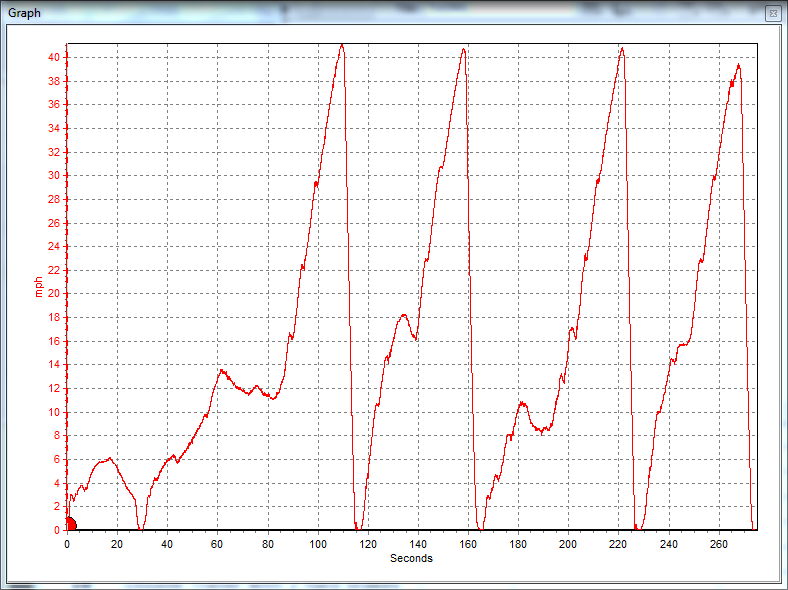
| 1 | 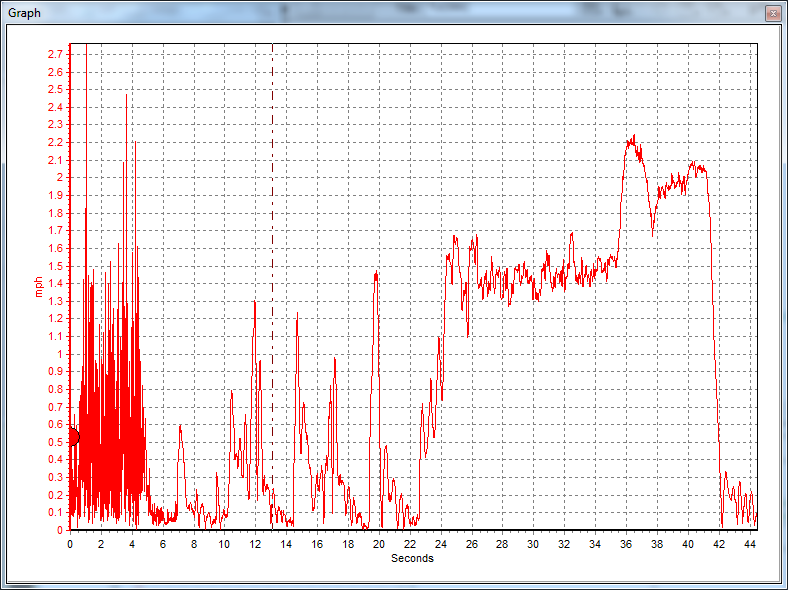 |
Backing out from parking space. |
| 2 | 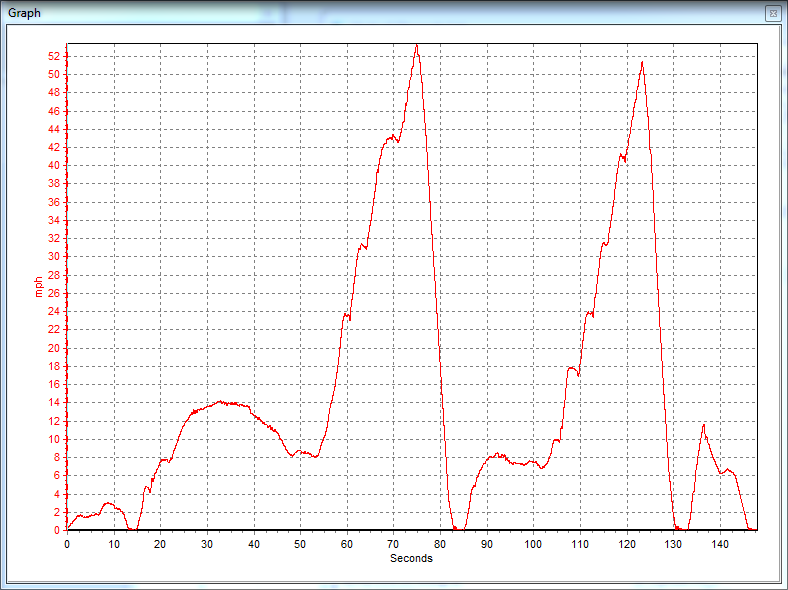 |
|
| 3 | 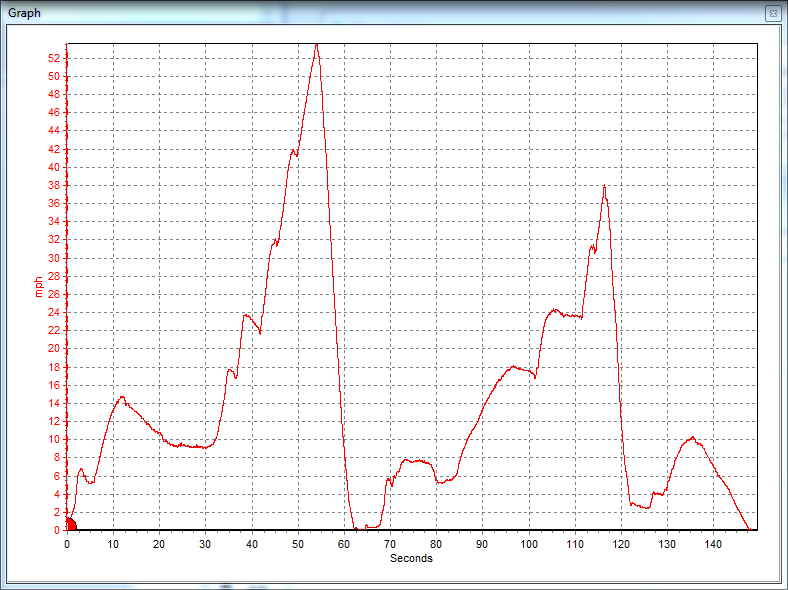 |
|
| 4 | 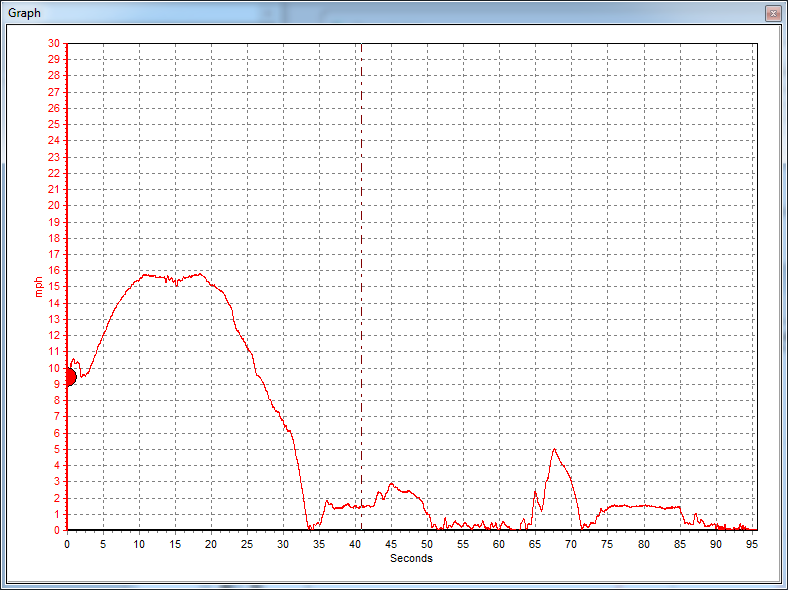 |
|
| 5 | 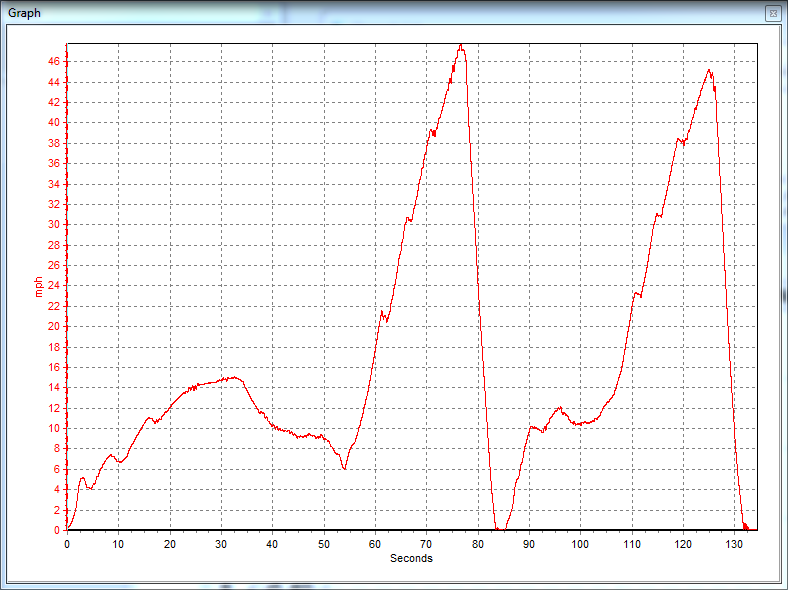 |
|
| 6 | 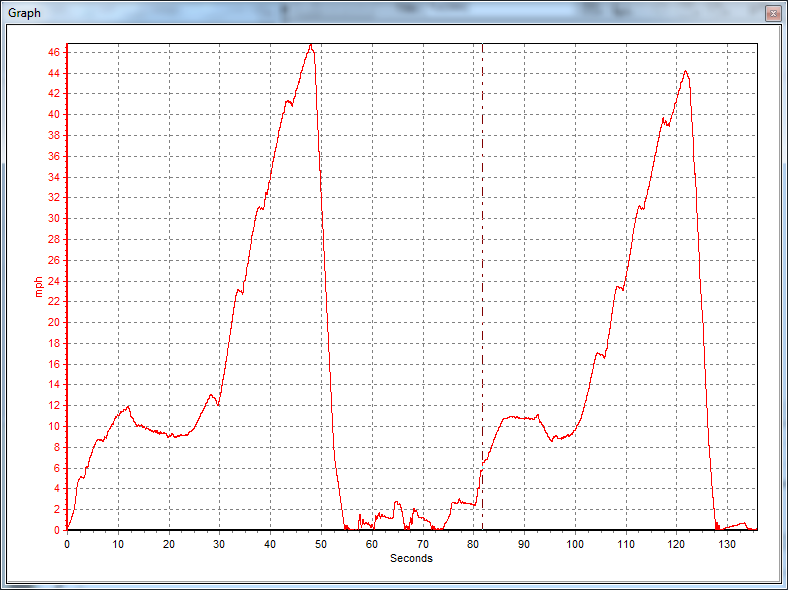 |
|
| 7 | 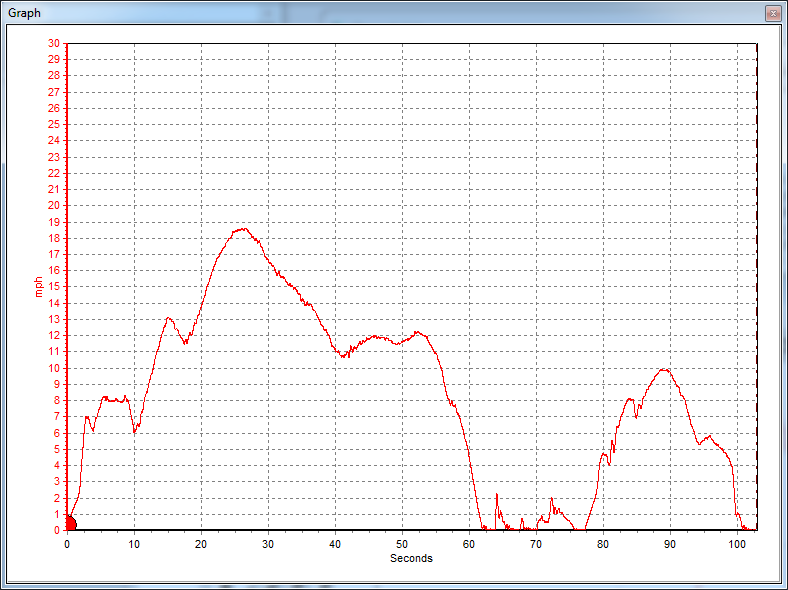 |
|
| 8 | 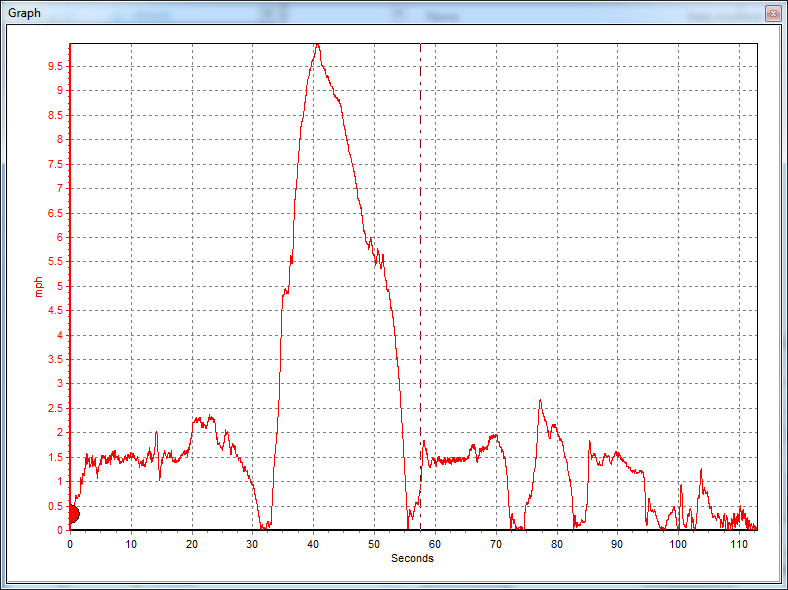 |
|
9
|
 |
VBox file is combined with Run 10. |
| 10 | ||
| 11 | 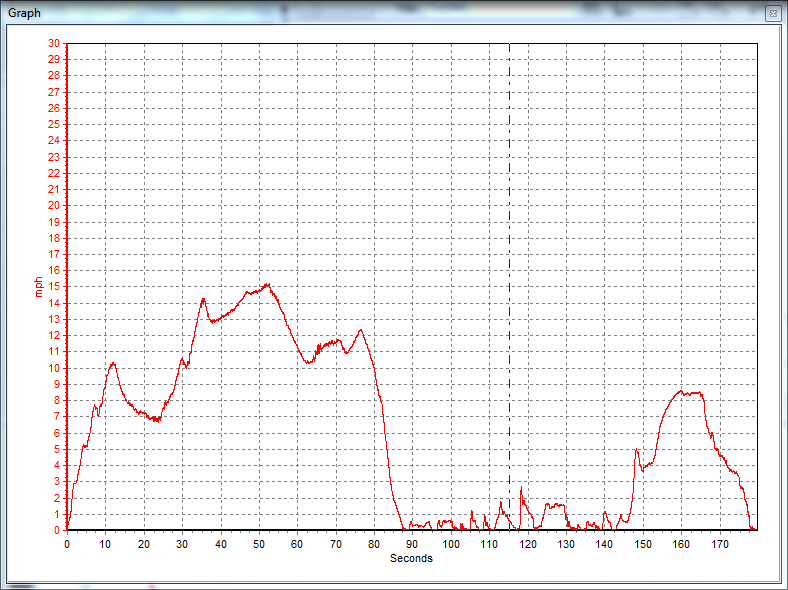 |
These data are available to anyone for further research.
Discussion of Results and Interesting Observations
Quick Calculation of Drag Factors
A drag factor is a ratio of accelerations. The ratio of the actual vehicle acceleration to the acceleration due to gravity. The actual acceleration can be estimated by calculating a change in velocity in a specific amount of time. Drag foactors are useful in determining speeds and other time-distance relationships. A consistent change in velocity is represented by a linear section on a speed vs time graph. The formula for drag factor is
f = (v2 - v1) / (t2 - t1) / g
If the instrumentation and J1939 messages are using km/h for the speed measurement and time is in seconds, then the acceleration due to gravity needs to be converted to units of km/h/s.
g = 9.81 m/s/s * 3600 s/h * 0.001 km/m = 35.316 km/h/s
The speeds and times can be picked from the graph in the Infield software. For example, the image below shows a velocity of 79.31 km/h at a time of 150.935 seconds (from when the run started).
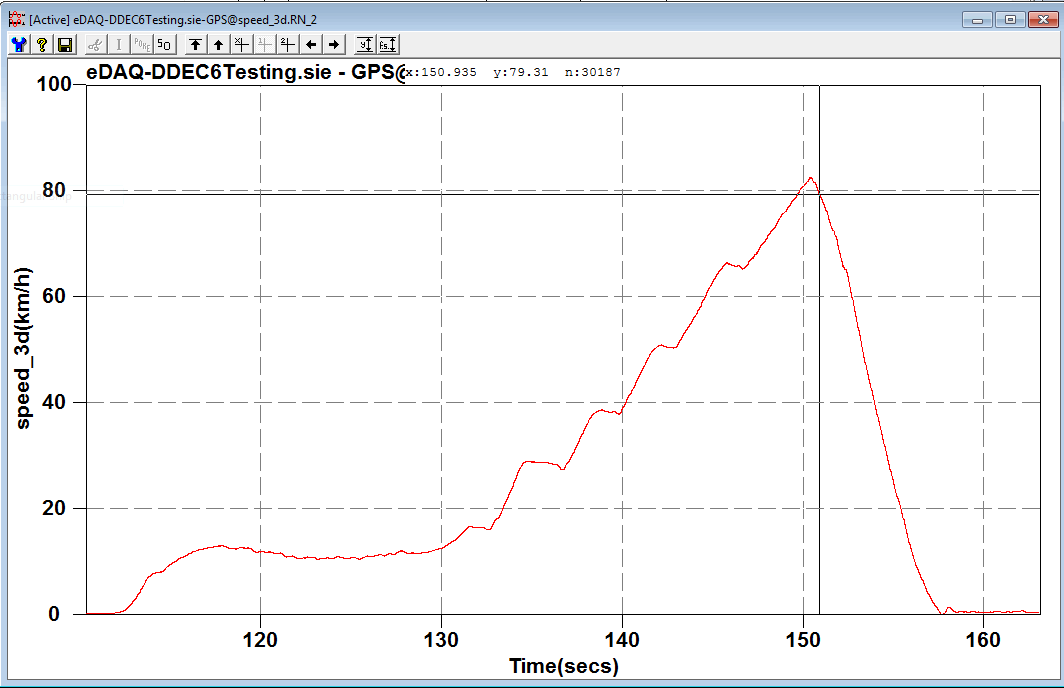
Using the method of picking two points is a relatively quick and reliable method to get some estimates for drag factors. The section between the two picked points should look fairly linear to ensure a good estimate. Some example drag factors were determined and presented in the following table. All speeds were based on the eGPS-200 measurement of 3-D speed.
| Run | Description | v1 (km/h) | v2 (km/h) | t1 (sec) | t2 (sec) | Drag Factor |
|---|---|---|---|---|---|---|
| 2a | First hard brake - tactor | 81.23 | 2.53 | 91.895 | 98.450 | -0.340 |
| 2b | Second hard brake - tractor | 79.31 | 7.85 | 150.935 | 156.465 | -0.366 |
| 3a | Third hard brake - tractor | 83.40 | 5.73 | 82.485 | 88.830 | -0.347 |
| 3b | Fourth hard brake - tractor | 57.32 | 9.82 | 147.170 | 151.170 | -0.336 |
| 5a | First hard brake with single trailer | 75.19 | 4.20 | 244.835 | 250.310 | -0.367 |
| 5b | Second hard brake with single trailer | 68.82 | 3.18 | 301.950 | 307.080 | -0.362 |
| 6a | Third hard brake with single trailer | 71.78 | 6.01 | 231.945 | 236.730 | -0.389 |
| 6b | Fourth hard brake with single trailer | 69.13 | 3.68 | 311.970 | 316.760 | -0.387 |
| 9a | First hard brake with two trailers | 65.18 | 3.95 | 96.445 | 100.630 | -0.414 |
| 9b | Second hard brake with two trailers | 64.11 | 2.06 | 156.090 | 160.465 | -0.402 |
| 10a | Third hard brake with two trailers | 63.43 | 3.92 | 189.715 | 193.570 | -0.437 |
| 10b | Fourth hard brake with two trailers | 61.07 | 2.44 | 251.300 | 255.405 | -0.404 |
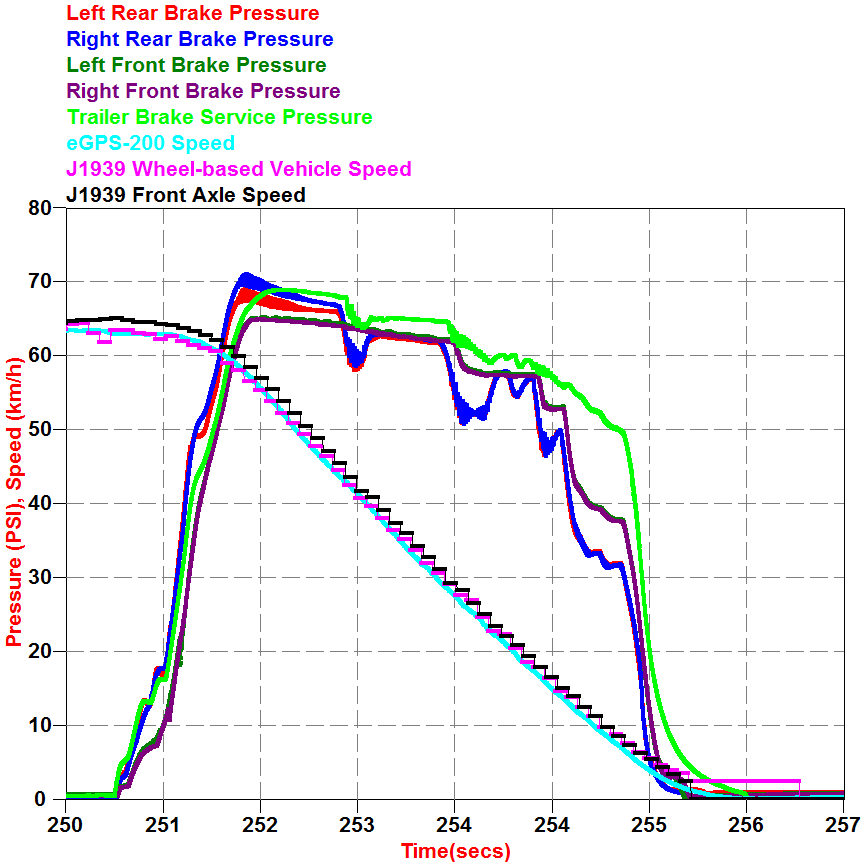
Notice that the drag factors are clumped together as they relate to the number of trailers. As the number of trailers increases, so does the ability of the rig to stop. This doesn't make sense, becasue a bobtail with functional brakes and ABS should be able to stop as well or better than a rig pulling a trailer. Further investigation was necessary, and it was discovered that the right rear brakes were not functional on the tractor.
See video showing malfunctioning brake inspection.
Air Brake Pressure with Anti lock braking