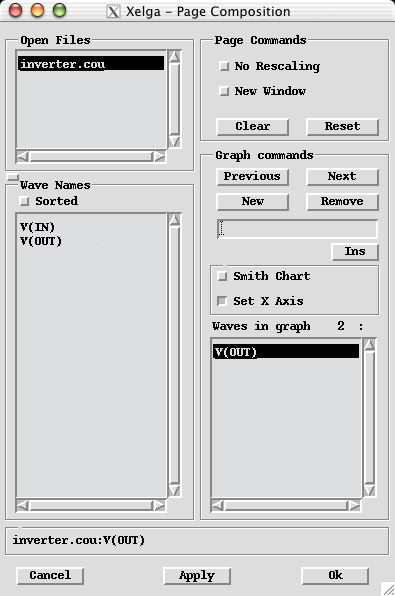
The threshold voltage of an inverter can best be measured using a slow sweep of the input voltage (so the delay of the gate doesn't give a temporal offset). If the sweep is slow enough, it will provide basically a step-by-step DC analysis. The key to getting the threshold voltage is graphing Vout as a function of Vin (y=vout, x=vin; graph y(x)). This can be accomplished using the menu item Page:Composition. Select the v(out) plot in the "waves in graph" section.
Select the "Set x axis" radio button. Click the v(in) plot from the "Wave names" section.
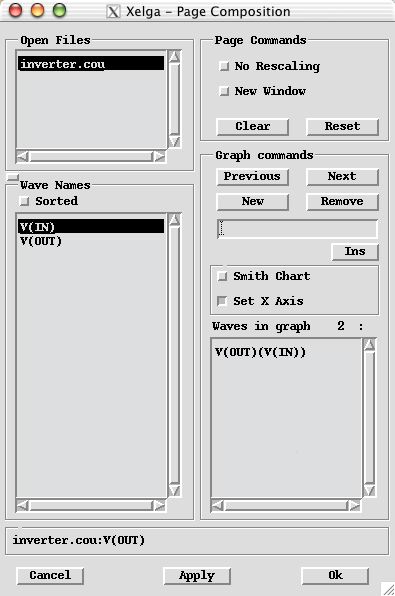
Now, by clicking ok, you should get a graph similar to this:
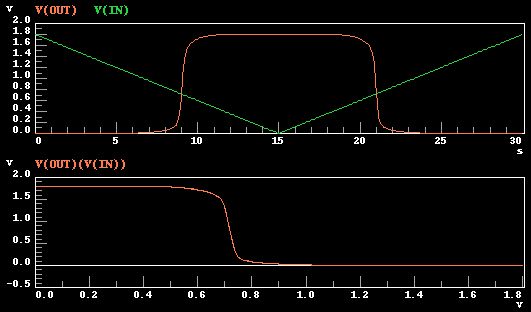
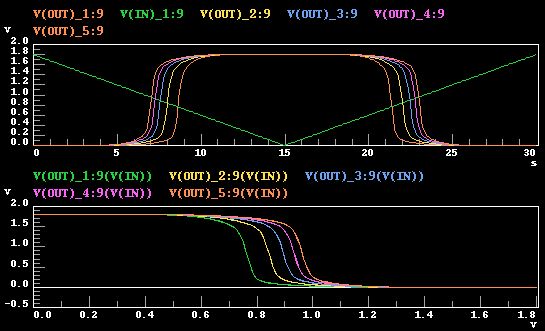
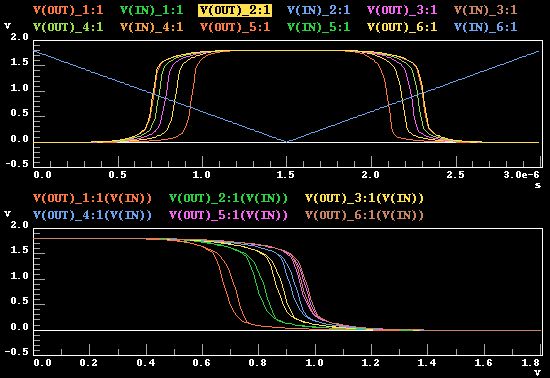
The threshold voltage is the point on the x-axis where the output goes through VDD/2 (in this case, it is about 0.72V). In a balanced gate Vth = VDD/2. The easy way to find this is to graph of a bunch of different inverter ratios, or use a .extract and .sweep statement (see the Eldo users reference). E.g. v(out)_3:9 is pretty close to balanced (you can and should get better)